Category Archives: webometrics

The Performance Management in Higher Education

This is an excerpt from my latest academic article, entitled; “Using the balanced scorecard as a performance management tool in higher education” that will be published in Sage’s “Management in Education” (Journal).


The higher education institutions (HEIs) are competing in a global marketplace, particularly those which are operating in the contexts of neoliberal policymaking (Fadeeva and Mochizuki, 2010; Deem et al., 2008; Olssen and Peters, 2005; Bleiklie, 2001). Several universities are characterized by their de-centralized leadership as they operate with budget constraints (Smeenk, Teelken, Eisinga and Doorewaard, 2008; Bleiklie, 2001). Notwithstanding, their stakeholders expect their increased accountability and quality assurance, in terms of their efficiency, economy and effectiveness (Witte and López-Torres, 2017; Smeek et al., 2008). Hence, HEIs set norms, standards, benchmarks, and quality controls to measure their performance; as they are increasingly market-led and customer-driven (Jauhiainen, Jauhiainen, Laiho and Lehto, 2015; Billing, 2004; Etzkowitz, et al., 2000). Specifically, the universities’ performance is having a positive effect on the economic development of societies; through the provision of inclusive, democratized access to quality education and high impact research (Arnesen & Lundahl, 2006). Moreover, the educational institutions are also expected to forge strong relationships with marketplace stakeholders, including business and industry (Waring, 2013).

As a result, many universities have adapted, or are trying to adapt to the changing environment as they re-structure their organization and put more emphasis on improving their organizational performance. These developments have inevitably led to the emergence of bureaucratic procedures and processes (Jauhiainen et al., 2015).  HEIs have even started using the corporate language as they formulate plans, set objectives, and use performance management criteria to control their resources (Smeenk et al., 2008; Ball, 2003). For instance, the Finnish universities have introduced new steering mechanisms, including the performance systems in budgeting, organizational reforms, management methods and salary systems (Camilleri, 2018; Jauhiainen et al., 2015). Previously, Welch (2007) noted that HEIs were adopting new modes of governance, organizational forms, management styles, and values that were prevalent in the private business sector. The logic behind these new managerial reforms was to improve the HEIs’ value for money principles (Waring, 2013; Deem, 1998). Therefore, the financing of HEIs is a crucial element in an imperfectly competitive, quasi-market model (Marginson, 2013; Olssen and Peters, 2005; Enders, 2004; Dill, 1997).

Academic commentators frequently suggest that the managerial strategies, structures, and values that belong to the ‘private sector’ are leading to significant improvements in the HEIs’ performance (Waring, 2013; Teelken, 2012; Deem and Brehony, 2005; Deem, 1998). On the other hand, critics argue that the ‘managerial’ universities are focusing on human resource management (HRM) practices that affect the quality of their employees’ job performance (Smeenk et al., 2008). Very often, HEIs are employing bureaucratic procedures involving time-consuming activities that could otherwise have been invested in research activities and / or to enhance teaching programs. The HEIs’ management agenda is actually imposed on the academics’ norms of conduct and on their professional behaviors. Therefore, the universities’ leadership can affect the employees’ autonomies as they are expected to comply with their employers’ requirements (Deem and Brehony, 2005). Smeenk et al. (2008) posited that this contentious issue may lead to perennial conflicts between the employees’ values and their university leaders’ managerial values; resulting in lower organizational commitment and reduced productivities.

The HEIs’ managerial model has led to a shift in the balance of power from the academics to their leaders as the universities have developed quality assurance systems to monitor and control their academic employees’ performance (Camilleri, 2018; Cardoso, Tavares and Sin, 2015). This trend towards managerialism can be perceived as a lack of trust in the academic community. However, the rationale behind managerialism is to foster a performative culture among members of staff, as universities need to respond to increased competitive pressures for resources, competences and capabilities (Decramer et al., 2013; Marginson, 2006; 2001; Enders, 2004). These issues have changed the HEIs’ academic cultures and norms in an unprecedented way (Chou and Chan, 2016; Marginson, 2013).

HEIs have resorted to the utilization of measures and key performance indicators to improve their global visibility. Their intention is to raise their institutions’ profile by using metrics that measure productivity. Many universities have developed their own performance measures or followed frameworks that monitor the productivity of academic members of staff (Taylor and Baines, 2012). Very often, their objective is to audit their academic employees’ work. However, their work cannot always be quantified and measured in objective performance evaluations. For instance, Waring (2013) argued that academic employees are expected to comply with their employers’ performance appraisals (PAs) and their form-filling exercises. The rationale behind the use of PAs is to measure the employees’ productivity in the form of quantifiable performance criteria. Hence, the PA is deemed as a vital element for the evaluation of the employees’ performance (Kivistö et al., 2017; Dilts et al., 1994). The PA can be used as part of a holistic performance management approach that measures the academics’ teaching, research and outreach. This performance management tool can possibly determine the employees’ retention, promotion, tenure as well as salary increments (Subbaye, 2018; Ramsden, 1991).

Therefore, PAs ought to be clear and fair. Their administration should involve consistent, rational procedures that make use of appropriate standards. The management’s evaluation of the employees’ performance should be based on tangible evidence. In a similar vein, the employees need to be informed of what is expected from them (Dilts et al., 1994). They should also be knowledgeable about due processes for appeal arising from adverse evaluations, as well as on grievance procedures, if any (Author, 2018). In recent years; the value of the annual performance appraisals (PAs) has increasingly been challenged in favor of more regular ‘performance conversations’ (Aguinis, 2013; Herdlein, Kukemelk and Türk, 2008). Therefore, regular performance feedback or the frequent appraisal of employees still remain a crucial aspect of the performance management cycle. Pace (2015) reported that the PA was used to develop the employees’ skills, rather than for administrative decisions. In a similar vein, the University of Texas (2019) HR page suggests that the appraisers’ role is “to set expectations, gather data, and provide ongoing feedback to employees, to assist them in utilizing their skills, expertise and ideas in a way that produces results”. However, a thorough literature review suggests that there are diverging views among academia and practitioners on the role of the annual PA, the form it should take, and on its effectiveness in the realms of higher education (Herdlein et al., 2008; DeNisi and Pritchard, 2006).

The Performance Management Frameworks

The HEIs’ evaluative systems may include an analysis of the respective universities’ stated intentions, peer opinions, government norms and comparisons, primary procedures from ‘self-evaluation’ through external peer review. These metrics can be drawn from published indicators and ratings, among other frameworks (Billing, 2004).  Their performance evaluations can be either internally or externally driven (Cappiello and Pedrini, 2017). The internally driven appraisal systems put more emphasis on self-evaluation and self-regulatory activities (Baxter, 2017; Bednall, Sanders and Runhaar, 2014; Dilts et al., 1994). Alternatively, the externally driven evaluative frameworks may involve appraisal interviews that assess the quality of the employees’ performance in relation to pre-established criteria (DeNisi and Pritchard, 2006; Cederblom, 1982).

Many countries, including the European Union (EU) states have passed relevant legislation, regulatory standards and guidelines for the HEIs’ quality assurance (Baxter, 2017), and for the performance evaluations of their members of staff (Kohoutek et al., 2018; Cardoso et al., 2015; Bleiklie, 2001). Of course, the academic employees’ performance is usually evaluated against their employers’ priorities, commitments, and aims; by using relevant international benchmarks and targets (Lo, 2009). The academics are usually appraised on their research impact, teaching activities and outreach (QS Ranking, 2019; THE, 2019). Their academic services, including their teaching resources, administrative support, and research output all serve as performance indicators that can contribute to the reputation and standing of the HEI that employs them (Geuna and Martin, 2003).

Notwithstanding, several universities have restructured their faculties and departments to enhance their research capabilities. Their intention is to improve their institutional performance in global rankings (Lo, 2014). Therefore, HEIs recruit academics who are prolific authors that publish high-impact research with numerous citations in peer reviewed journals (Wood and Salt, 2018; Author, 2018). They may prefer researchers with scientific or quantitative backgrounds, regardless of their teaching experience (Chou and Chan, 2016). These universities are prioritizing research and promoting their academics’ publications to the detriment of university teaching. Thus, the academics’ contributions in key international journals is the predominant criterion that is used to judge the quality of academia (Billing, 2004). For this reason, the vast majority of scholars are using the English language as a vehicle to publish their research in reputable, high impact journals (Chou and Chan, 2016). Hence, the quantity and quality of their research ought to be evaluated through a number of criteria (Lo, 2014; 2011; Dill and Soo, 2005).

University ranking sites, including (THE) and the QS Rankings, among others, use performance indicators to classify and measure the quality and status of HEIs. This would involve the gathering and analysis of survey data from academic stakeholders. THE and QS, among others clearly define the measures, their relative weight, and the processes by which the quantitative data is collected (Dill and Soo, 2005). The Academic Ranking of World Universities (ARWU) relies on publication-focused indicators as 60 percent of its weighting is assigned to the respective university’s research output. Therefore, these university ranking exercises are surely affecting the policies, cultures and behaviors of HEIs and of their academics (Wood and Salt, 2018; De Cramer et al., 2013; Lo, 2013).  For instance, the performance indicators directly encourage the recruitment of international faculty and students. Other examples of quantitative metrics include the students’ enrolment ratios, graduate rates, student drop-out rates, the students’ continuation of studies at the next academic level, and the employability index of graduates, among others. Moreover, qualitative indicators can also provide insightful data on the students’ opinions and perceptions about their learning environment. The HEIs could evaluate the students’ satisfaction with teaching; satisfaction with research opportunities and training; perceptions of international and public engagement opportunities; ease of taking courses across boundaries, and may also determine whether there are administrative / bureaucratic barriers for them (Kivistö et al., 2017; Jauhiainen et al., 2015; Ramsden, 1991). Hence, HEIs ought to continuously re-examine their strategic priorities and initiatives. It is in their interest to regularly analyze their performance management frameworks through financial and non-financial indicators, in order to assess the productivity of their human resources. Therefore, they should regularly review educational programs and course curricula (Kohoutek et al., 2018; Brewer and Brewer, 2010). On a faculty level, the university leaders ought to keep a track record of changes in the size of departments; age and distribution of academic employees; diversity of students and staff, in terms of gender, race and ethnicity, et cetera. In addition, faculties could examine discipline-specific rankings; and determine the expenditures per academic member of staff, among other options (Author, 2018).

The balanced scorecard

The balanced scorecard (BSC) was first introduced by Kaplan and Norton (1992) in their highly cited article, entitled “The Balanced Scorecard: Measures that Drive Performance”. BSC is an integrated results-oriented, performance management tool, consisting of financial and non-financial measures that link the organizations’ mission, core values, and vision for the future with strategies, targets, and initiatives that are designed to bring continuous improvements (Taylor and Baines, 2012; Wu, Lin and Chang, 2011; Beard, 2009; Umashankar and Dutta, 2007; Cullen, Joyce, Hassall and Broadbent, 2003; Kaplan and Norton, 1992). Its four performance indicators play an important role in translating strategy into action; and can be utilized to evaluate the performance of HEIs. BSC provides a balanced performance management system as it comprises a set of performance indices that can assess different organizational perspectives (Taylor and Baines, 2012). For BSC, the financial perspective is a core performance measure. However, the other three perspectives namely: customer (or stakeholder), organizational capacity and internal process ought to be considered in the performance evaluations of HEIs, as reported in the following table:

BSC Higher Education

The balanced scorecard approach in higher education

Cullen et al. (2003) suggested that the UK’s Higher Education Funding Council for England (HEFCE), the Scottish Funding Council (SHEFC), the Higher Education Funding Council for Wales (HEFCW), as well as the Department for Employment and Learning (DELNI) have incorporated the BSC’s targets in their Research Excellence Framework. Furthermore, other HEI targets, including: the students’ completion rates, the research impact of universities, collaborative partnerships with business and industry, among others, are key metrics that are increasingly being used in international benchmarking exercises, like the European Quality Improvement System (EQUIS), among others. Moreover, BSC can be used to measure the academic employees’ commitment towards their employer (Umashankar and Dutta, 2007; McKenzie, and Schweitzer, 2001). Notwithstanding, Wu, Lin and Chang (2011) contended that the BSC’s ‘‘organizational capacity’’ is related to the employee development, innovation and learning. Hence the measurement of the HEIs’ intangible assets, including their intellectual capital is affected by other perspectives, including the financial one (Taylor and Baines, 2012). This table summarizes some of the strengths and weaknesses of the balanced scorecard.

BSC

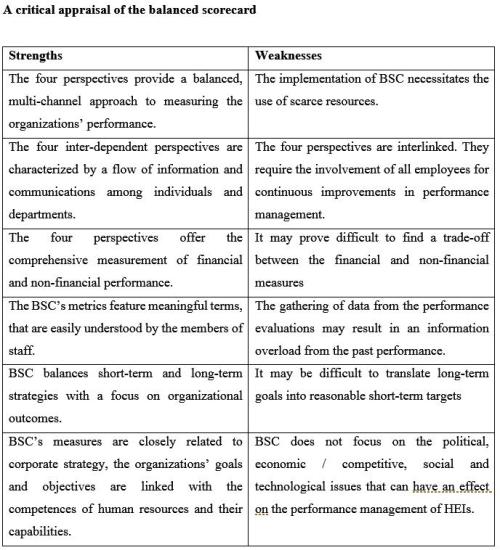
BSC is widely used to appraise the financial and non-financial performance of businesses and public service organizations including HEIs. Many HEI leaders are increasingly following business-like approaches as they are expected to operate in a quasi-market environment (Marginson, 2013). They need to scan their macro environment to be knowledgeable about the opportunities and threats from the political, economic, social and technological factors. Moreover, they have to regularly analyze their microenvironment by evaluating their strengths and weaknesses.  Hence, several HEIs are increasingly appraising their employees as they assess their performance on a regular basis. They may even decide to take remedial actions when necessary.  Therefore, BSC can also be employed by HEIs to improve their academic employees’ productivity levels (Marginson, 2013; 2000).


A pre-publication version of the full article is available through ResearchGate and Academia.edu.

Advertisement

Leave a comment

Filed under academia, Balanced Scorecard, Education, Education Leadership, Higher Education, Human Resources, human resources management, performance appraisals, performance management, University Ranking, webometrics

Measuring the Academic Impact of Higher Education Institutions and Research Centres

uni

Although research impact metrics can be used to evaluate individual academics, there are other measures that could be used to rank and compare academic institutions. Several international ranking schemes for universities use citations to estimate the institutions’ impact. Nevertheless, there have been ongoing debates about whether bibliometric methods should be used for the ranking of academic institutions.

The most productive universities are increasingly enclosing the link to their papers online. Yet, many commentators argue that hyperlinks could be unreliable indicators of journal impact (Kenekayoro, Buckley & Thelwall, 2014; Vaughan & Hysen, 2002). Notwithstanding, the web helps to promote research funding initiatives and to advertise academic related jobs. The webometrics could also monitor the extent of mutual awareness in particular research areas (Thelwall, Klitkou, Verbeek, Stuart & Vincent, 2010).

Moreover, there are other uses of webometric indicators in policy-relevant contexts within the European Union (Thelwall et al., 2010; Hoekman, Frenken & Tijssen, 2010). The webometrics refer to the quantitative analysis of web activity, including profile views and downloads (Davidson, Newton, Ferguson, Daly, Elliott, Homer, Duffield & Jackson, 2014). Therefore, webometric ranking involves the measurement of volume, visibility and impact of web pages. These metrics seem to emphasise on scientific output including peer-reviewed papers, conference presentations, preprints, monographs, theses and reports. They also analyse other academic material including courseware, seminar documentation, digital libraries, databases, multimedia, personal pages and blogs among others (Thelwall, 2009; Kousha & Thelwall, 2015; Mas-Bleda, Thelwall, Kousha & Aguillo, 2014a; Mas-Bleda, Thelwall, Kousha & Aguillo, 2014b; Orduna-Malea & Ontalba-Ruipérez, 2013). Thelwall and Kousha (2013) have identified and explained the methodology of five well-known institutional ranking schemes:

  • “QS World University Rankings aims to rank universities based upon academic reputation (40%, from a global survey), employer reputation (10%, from a global survey), faculty-student ratio (20%), citations per faculty (20%, from Scopus), the proportion of international students (5%), and the proportion of international faculty (5%).
  • The World University Rankings: aims to judge world class universities across all of their core missions – teaching, research, knowledge transfer and international outlook by using the Web of Science, an international survey of senior academics and self-reported data. The results are based on field-normalised citations for five years of publications (30%), research reputation from a survey (18%), teaching reputation (15%), various indicators of the quality of the learning environment (15%), field-normalised publications per faculty (8%), field-normalised income per faculty (8%), income from industry per faculty (2.5%); and indicators for the proportion of international staff (2.5%), students (2.5%), and internationally co-authored publications (2.5%, field-normalised).
  • The Academic Ranking of World Universities (ARWU) aims to rank the “world top 500 universities” based upon the number of alumni and staff winning Nobel Prizes and Fields Medals, number of highly cited researchers selected by Thomson Scientific, number of articles published in journals of Nature and Science, number of articles indexed in Science Citation Index – Expanded and Social Sciences Citation Index, and per capita performance with respect to the size of an institution.
  • The CWTS Leiden Ranking aims to measure “the scientific performance” of universities using bibliometric indicators based upon Web of Science data through a series of separate size- and field-normalised indicators for different aspects of performance rather than a combined overall ranking. For example, one is “the proportion of the publications of a university that, compared with other publications in the same field and in the same year, belong to the top 10% most frequently cited” and another is “the average number of citations of the publications of a university, normalised for field differences and publication year.”
  • The Webometrics Ranking of World Universities Webometrics Ranking aims to show “the commitment of the institutions to [open access publishing] through carefully selected web indicators”: hyperlinks from the rest of the web (1/2), web site size according to Google (1/6), and the number of files in the website in “rich file formats” according to Google Scholar (1/6), but also the field-normalised number of articles in the most highly cited 10% of Scopus publications (1/6)” (Thelwall & Kousha, 2013).

Evidently, the university ranking systems use a variety of factors in their calculations, including their web presence, the number of publications, the citations to publications and peer judgements (Thelwall and Kousha, 2013; Aguillo, Bar-Ilan, Levene, & Ortega, 2010). These metrics typically reflect a combination of different factors, as shown above. Although they may have different objectives, they tend to give similar rankings. It may appear that the universities that produce good research also tend to have an extensive web presence, perform well on teaching-related indicators, and attract many citations (Matson et al., 2003).

On the other hand, the webometrics may not necessarily provide robust indicators of knowledge flows or research impact. In contrast to citation analysis, the quality of webometric indicators is not high unless irrelevant content is filtered out, manually. Moreover, it may prove hard to interpret certain webometric indicators as they could reflect a range of phenomena ranging from spam to post publication material. Webometric analyses can support science policy decisions on individual fields. However, for the time being, it is difficult to tackle the issue of web heterogeneity in lower field levels (Thelwall & Harries, 2004; Wilkinson, Harries, Thelwall & Price, 2003). Moreover, Thelwall et al., (2010) held that webometrics would not have the same relevance for every field of study. It is very likely that fast moving or new research fields could not be adequately covered by webometric indicators due to publication time lags. Thelwall et al. (2010) argued that it could take up to two years to start a research and to have it published. This would therefore increase the relative value of webometrics as research groups can publish general information online about their research.

This is an excerpt from: Camilleri, M.A. (2016) Utilising Content Marketing and Social Networks for Academic Visibility. In Cabrera, M. & Lloret, N. Digital Tools for Academic Branding and Self-Promotion. IGI Global (Forthcoming).

Leave a comment

Filed under Higher Education, Marketing, University Ranking, webometrics

Using Content Marketing Metrics for Academic Impact

Academic contributions start from concepts and ideas. When their content is relevant and of a high quality they can be published in renowned, peer-reviewed journals. Researchers are increasingly using online full text databases from institutional repositories or online open access journals to disseminate their findings. The web has surely helped to enhance fruitful collaborative relationships among academia. The internet has brought increased engagement among peers, over email or video. In addition, they may share their knowledge with colleagues as they present their papers in seminars and conferences. After publication, their contributions may be cited by other scholars.

The researchers’ visibility does not only rely on the number of publications. Both academic researchers and their institutions are continuously being rated and classified. Their citations may result from highly reputable journals or well-linked homepages providing scientific content. Publications are usually ranked through metrics that will assess individual researchers and their organisational performance. Bibliometrics and citations may be considered as part of the academic reward system. Highly cited authors are usually endorsed by their peers for their significant contribution to knowledge by society. As a matter of fact, citations are at the core of scientometric methods as they have been used to measure the visibility and impact of scholarly work (Moed, 2006; Borgman, 2000). This contribution explores extant literature that explain how the visibility of individual researchers’content may be related to their academic clout. Therefore, it examines the communication structures and processes of scholarly communications (Kousha and Thelwall, 2007; Borgmann and Furner 2002). It presents relevant theoretical underpinnings on bibliometric studies and considers different methods that can analyse the individual researchers’ or their academic publications’ impact (Wilson, 1999; Tague-Sutcliffe, 1992).


Citation Analysis
The symbolic role of citation in representing the content of a document is an extensive dimension of information retrieval. Citation analysis expands the scope of information seeking by retrieving publications that have been cited in previous works. This methodology offers enormous possibilities for tracing trends and developments in different research areas. Citation analysis has become the de-facto standard in the evaluation of research. In fact, previous publications can be simply evaluated on the number of citations and the relatively good availability of citation data for such purposes (Knoth and Herrmannova, 2014). However, citations are merely one of the attributes of publications. By themselves, they do not provide adequate and sufficient evidence of impact, quality and research contribution. This may be due to a wide range of characteristics they exhibit; including the semantics of the citation (Knoth and Herrmannova, 2014), the motives for citing (Nicolaisen, 2007), the variations in sentiment (Athar, 2014), the context of the citation (He, Pei, Kifer, Mitra and Giles, 2010), the popularity of topics, the size of research communities (Brumback, 2009; Seglen, 1997), the time delay for citations to show up (Priem and Hemminger, 2010), the skewness of their distribution (Seglen, 1992), the difference in the types of research papers (Seglen, 1997) and finally the ability to game / manipulate citations (Arnold and Fowler, 2010).

Impact Factors (IFs)
Scholarly impact is measure of frequency in which an “average article” has been cited over a defined time period in a journal (Glanzel and Moed, 2002). Journal citations reports are published in June, every year by Thomson-Reuters’ Institute of Scientific Information (ISI). These reports also feature data for ranking the Immediacy Index of articles, which measure the number of times an article appeared in academic citations (Harter, 1996). Publishers of core scientific journals consider IF indicators in their evaluations of prospective contributions. In Despite there are severe limitations in the IF’s methodology, it is still the most common instrument that ranks international journals in any given field of study. Yet, impact factors have often been subject to ongoing criticism by researchers for their methodological and procedural imperfections. Commentators often debate about how IFs should be used. Whilst a higher impact factor may indicate journals that are considered to be more prestigious, it does not necessarily reflect the quality or impact of an individual article or researcher. This may be attributable to the large number of journals, the volume of research contributions, and also the rapidly changing nature of certain research fields and the increasing representation of researchers. Hence, other metrics have been developed to provide alternative measures to impact factors.

h-index
The h-index attempts to calculate the citation impact of the academic publications of researchers. Therefore, this index measures the scholars productivity by taking into account their most cited papers and the number of citations that they received in other publications. This index can also be applied to measure the impact and productivity of a scholarly journal, as well as a group of scientists, such as a department or university or country (Jones, Huggett and Kamalski, 2011). The (Hirsch) h-index was originally developed in 2005 to estimate the importance, significance and the broad impact of an academic’s researcher’s cumulative research contributions. Initially, the h-index was designed to overcome the limitations of other measures of quality and productivity of researchers. It consists of a single number that reports on an author’s academic contributions that have at least the equivalent number of citations. For instance, an h-index of 3 would indicate that the author has published at least three papers that have been cited three times or more. Therefore, the most productive researcher may possibly obtaining a high h-index. Moreover, the best papers in terms of quality will be mostly cited. Interestingly, this issue is driving more researchers to publish in open access journals.


Webometrics
The science of webometrics (also cybermetrics) is still in an experimental phase. Björneborn and Ingwersen (2004) indicated that webometrics involves an assessment of different types of hyperlinks. They argued that relevant links may help to improve the impact of academic publications. Therefore, webometrics refer to the quantitative analysis of activity on the world wide web, such as downloads (Davidson, Newton, Ferguson, Daly, Elliott, Homer, Duffield and Jackson, 2014). Webometrics recognise that the internet is a repository for a massive number of documents. It disseminates knowledge to wide audiences. The webometric ranking involves the measurement of volume, visibility, and the impact of web pages. Webometrics emphasise on scientific output including peer-reviewed papers, conference presentations, preprints, monographs, theses, and reports. However, these kind of electronic metrics also analyse other academic material (including courseware, seminar documentation, digital libraries, databases, multimedia, personal pages and blogs among others). Moreover, webometrics consider online information on the educational institution, its departments, research groups, supporting services, and the level of students attending courses.

Web 2.0 and Social Media
Internet users are increasingly creating and publishing their content online. Never before has it been so easy for academics to engage with their peers on both current affairs and scientific findings. The influence of social media has changed the academic publishing scenario. As a matter of fact, recently there has been an increased recognition for measures of scholarly impact to be drawn from Web 2.0 data (Priem and Hemminger, 2010).

The web has not only revolutionised how data is gathered, stored and shared but also provided a mechanism of measuring access to information. Moreover, academics are also using personal web sites and blogs to enhance the visibility of their publications. This medium improves their content marketing in addition to traditional bibliometrics. Social media networks are providing blogging platforms that allows users to communicate to anyone with online access. For instance, Twitter is rapidly becoming used for work related purposes, particularly scholarly communication, as a method of sharing and disseminating information which is central to the work of an academic (Java, Song, Finin and Tseng B, 2007). Recently, there has been rapid growth in the uptake of Twitter by academics to network, share ideas and common interests, and promote their scientific findings (Davidson et al., 2014).

Conclusions and Implications

There are various sources of bibliometric data, each possess their own strengths and limitations. Evidently, there is no single bibliometric measure that is perfect. Multiple approaches to evaluation are highly recommended. Moreover, bibliometric approaches should not be the only measures upon which academic and scholarly performance ought to be evaluated. Sometimes, it may appear that bibliometrics can reduce the publications’ impact to a quantitative, numerical score. Many commentators have argued that when viewed in isolation these metrics may not necessarily be representative of a researcher’s performance or capacity. In taking this view, one would consider bibliometric measures as only one aspect of performance upon which research can be judged. Nonetheless, this chapter indicated that bibliometrics still have their high utility in academia. It is very likely that metrics will to continue to be in use because they represent a relatively simple and accurate data source. For the time being, bibliometrics are an essential aspect of measuring academic clout and organisational performance. A number of systematic ways of assessment have been identified in this regard; including citation analysis, impact factor, h-index and webometrics among others. Notwithstanding, the changes in academic behaviours and their use of content marketing on internet have challenged traditional metrics. Evidently, the measurement of impact beyond citation metrics is an increasing focus among researchers, with social media networks representing the most contemporary way of establishing performance and impact. In conclusion, this contribution suggests that these bibliometrics as well as recognition by peers can help to boost the researchers’, research groups’ and universities’ productivity and their quality of research.

References
Arnold, D. N., & Fowler, K. K. (2011). Nefarious numbers. Notices of the AMS, 58(3), 434-437.

Athar, A. (2014). Sentiment analysis of scientific citations. University of Cambridge, Computer Laboratory, Technical Report, (UCAM-CL-TR-856).

Borgman, C. L. (2000). Digital libraries and the continuum of scholarly communication. Journal of documentation, 56(4), 412-430.

Borgman, C. L., & Furner, J. (2002). Scholarly communication and bibliometrics.

Bornmann, L., & Daniel, H. D. (2005). Does the h-index for ranking of scientists really work?. Scientometrics, 65(3), 391-392.

Bornmann, L., & Daniel, H. D. (2007). What do we know about the h index?. Journal of the American Society for Information Science and technology, 58(9), 1381-1385.

Björneborn, L., & Ingwersen, P. (2004). Toward a basic framework for webometrics. Journal of the American Society for Information Science and Technology, 55(14), 1216-1227.

Glänzel, W., & Moed, H. F. (2002). Journal impact measures in bibliometric research. Scientometrics, 53(2), 171-193.

Harter, S. (1996). Historical roots of contemporary issues involving self-concept.

He, Q., Pei, J., Kifer, D., Mitra, P., & Giles, L. (2010, April). Context-aware citation recommendation. In Proceedings of the 19th international conference on World wide web (pp. 421-430). ACM.

Java, A., Song, X., Finin, T., & Tseng, B. (2007, August). Why we twitter: understanding microblogging usage and communities. In Proceedings of the 9th WebKDD and 1st SNA-KDD 2007 workshop on Web mining and social network analysis (pp. 56-65). ACM. http://scholar.google.com/scholar?q=http://dx.doi.org/10.1145/1348549.1348556

Knoth, P., & Herrmannova, D. (2014). Towards Semantometrics: A New Semantic Similarity Based Measure for Assessing a Research Publication’s Contribution. D-Lib Magazine, 20(11), 8.

Kousha, K., & Thelwall, M. (2007). Google Scholar citations and Google Web/URL citations: A multi‐discipline exploratory analysis. Journal of the American Society for Information Science and Technology, 58(7), 1055-1065.

Moed, H. F. (2006). Citation analysis in research evaluation (Vol. 9). Springer Science & Business Media.

Nicolaisen, J. (2007). Citation analysis. Annual review of information science and technology, 41(1), 609-641.

Priem, J., & Hemminger, B. H. (2010). Scientometrics 2.0: New metrics of scholarly impact on the social Web. First Monday, 15(7).

Seglen, P. O. (1992). The skewness of science. Journal of the American Society for Information Science, 43(9), 628-638.

Seglen, P. O. (1997). Why the impact factor of journals should not be used for evaluating research. Bmj, 314(7079), 497.

Tague-Sutcliffe, J. (1992). An introduction to informetrics. Information processing & management, 28(1), 1-3.

Wilson, C. S. (1999). Informetrics. Annual Review of Information Science and Technology (ARIST), 34, 107-247.

Leave a comment

Filed under webometrics